Help Documentation
Complete guide for using the CpuPDB platform
Navigation
Overview
The CpuPDB platform provides distinct search modalities across multiple pages: a Start Page for standard queries, an Explore Page for family relationship analysis, a Dynamics Page for molecular dynamics data, and a Detail Page for comprehensive interaction analysis.

1. Start Page
1.1 Search Based on PDB ID, Ligand ID, or Ligand SMILES
Users can perform single-parameter or combined searches using the above identifiers.
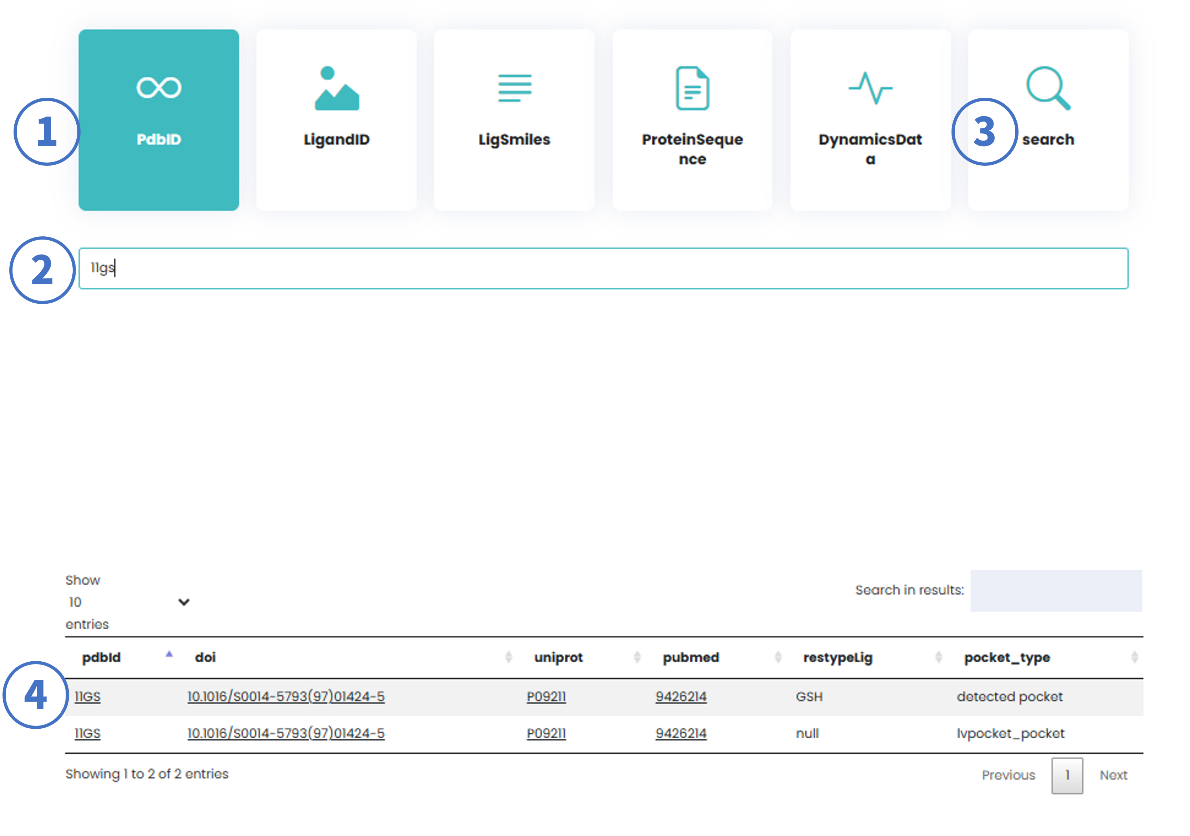
Workflow:
- Select "PDB ID" as the search type.
- Enter a PDB ID (e.g., 11GS).
- Click "Search" or press Enter.
- Refine results using secondary filters (e.g., input ligand ID: GSH).
- Search Results:
- PDB ID: Links to the detailed protein-ligand interaction interface (Detail Page).
- DOI/UniProt ID/PubMed ID: Hyperlinks to their respective official databases.
- restypeLig: Ligand identifier (HET code).
- pocket_type:
- LVPocket_pocket: Pockets predicted by LvPocket.
- detected_pocket: Pockets calculated by pykvFinder based on ligand positions.
1.2 Protein Sequence-Based Search
Users can submit protein sequences for homology-based retrieval (results generated via BLAST alignment).
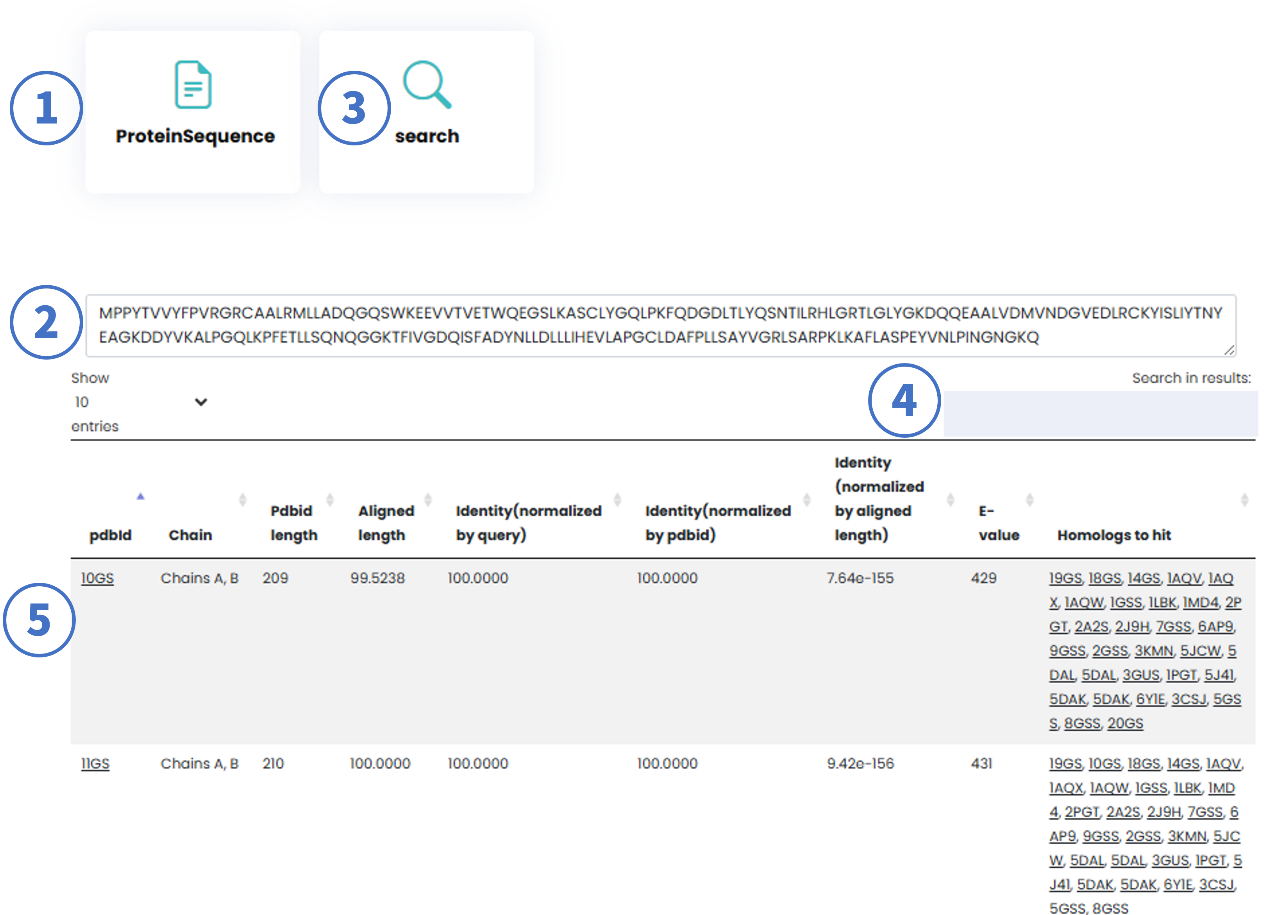
Workflow:
- Select "Protein Sequence" mode.
- Input a protein sequence (FASTA format).
- Click "Search" or press Enter.
- Refine results using in-result filters.
Result Metrics:
- PDB ID Length: Full sequence length of the matched protein.
- Aligned Length: Overlapping region between the query and target sequences.
- Identity (Normalized by query): Percentage of identical residues relative to the query length.
- Identity (Normalized by aligned length): Percentage identity within the aligned region.
- E-value: Statistical significance of the alignment (lower values indicate higher confidence).
- Homologs to Hit: PDB IDs with ≥95% sequence similarity (via CD-HIT). Clicking a PDB ID redirects to the Detail Page.
2. Explore Page
This interface visualizes protein family relationships through a topological network. Nodes represent protein-ligand complexes, and proteins from the same family are color-coded.
2.1 PDB ID-Based Search
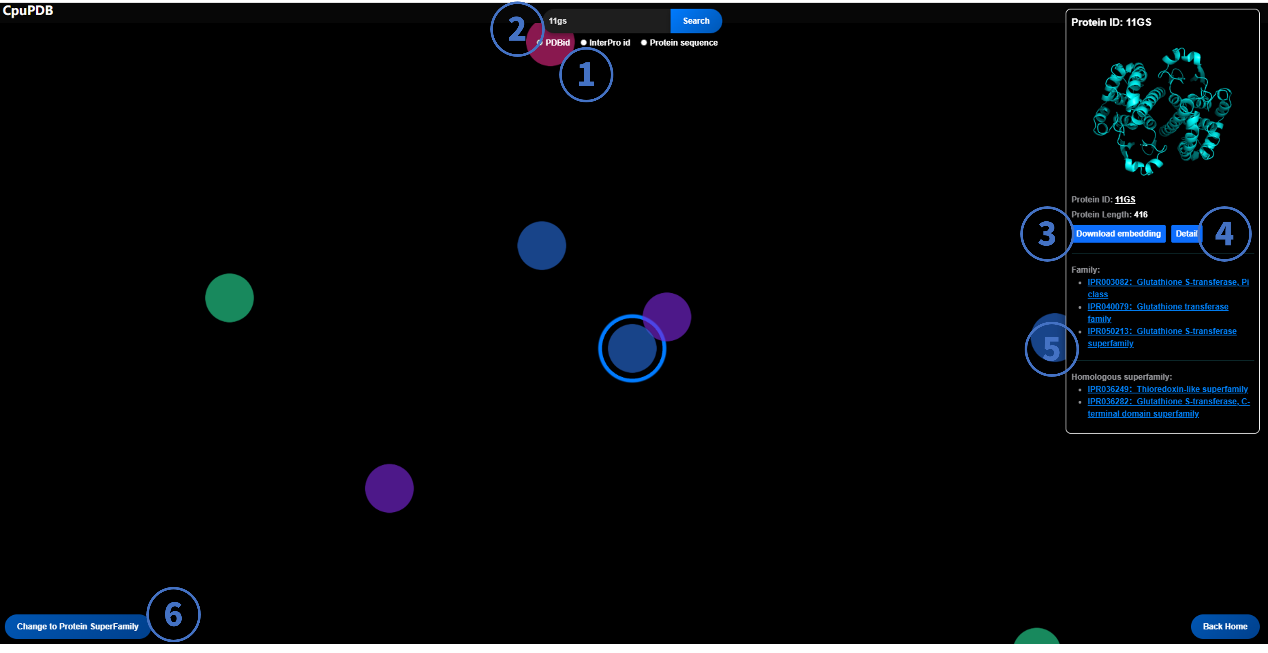
- Select "PDB ID" mode.
- Enter a PDB ID (e.g., 11GS)
- Download Embedding: Obtain ESM-calculated protein embeddings (FASTA format).
- "Detail" Button: Available only for entries with precomputed pocket data.
- InterPro ID: Hyperlinks to the InterPro database for family/superfamily details.
- Toggle between Family and Superfamily views.
2.2 InterPro ID-Based Search
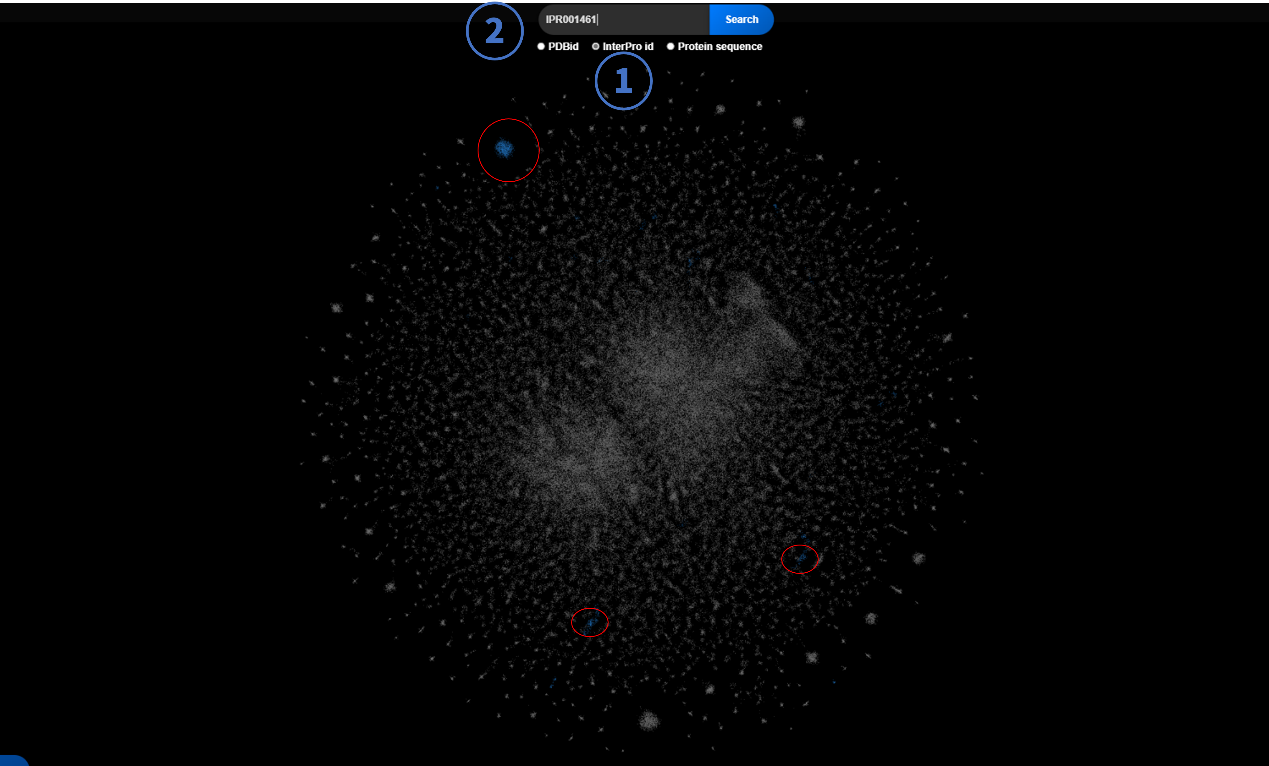
- Select "Protein Sequence" mode.
- Enter an InterPro ID (e.g., IPR000123).
- Non-matching nodes turn gray; matching nodes turn blue for emphasis.
2.3 Protein Sequence-Based Search
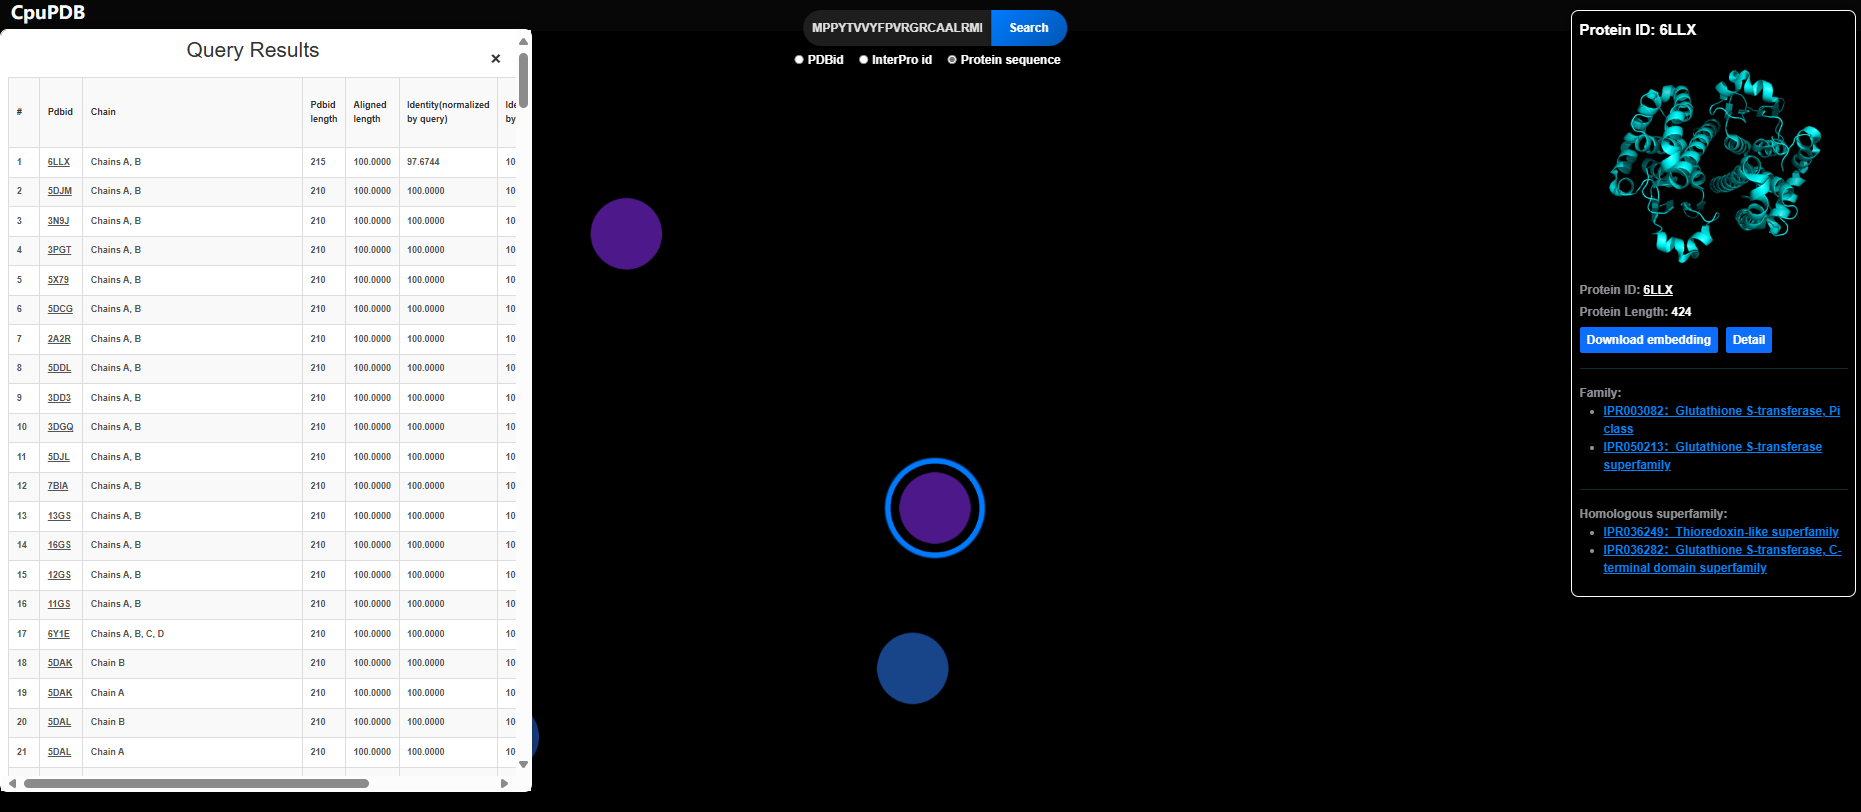
- Select "Protein Sequence" mode.
- Input a protein sequence.
- A Query Results table appears.
- Clicking a PDB ID displays the corresponding protein node in the network.
3. Dynamics Page
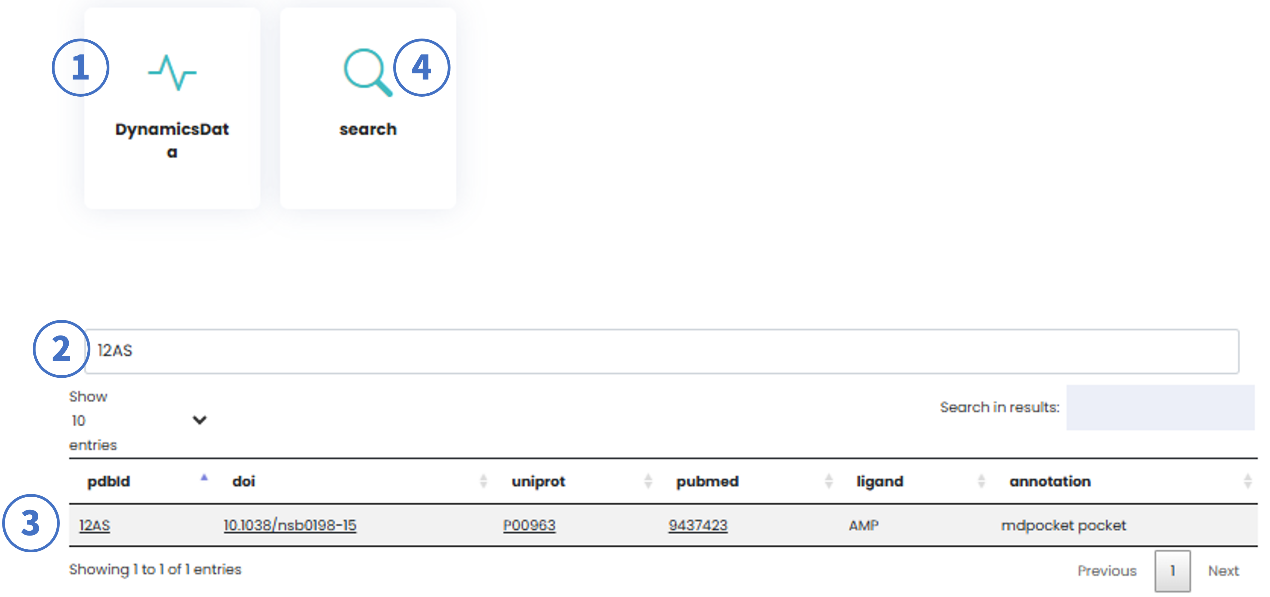
Workflow:
- Select "DynamicsData" as the search type from the Start Page.
- Enter a PDB ID (e.g., 12AS).
- Click "Search" or press Enter.
- The search result links to dynamics data analysis page.
3.1 3D Structure Visualization
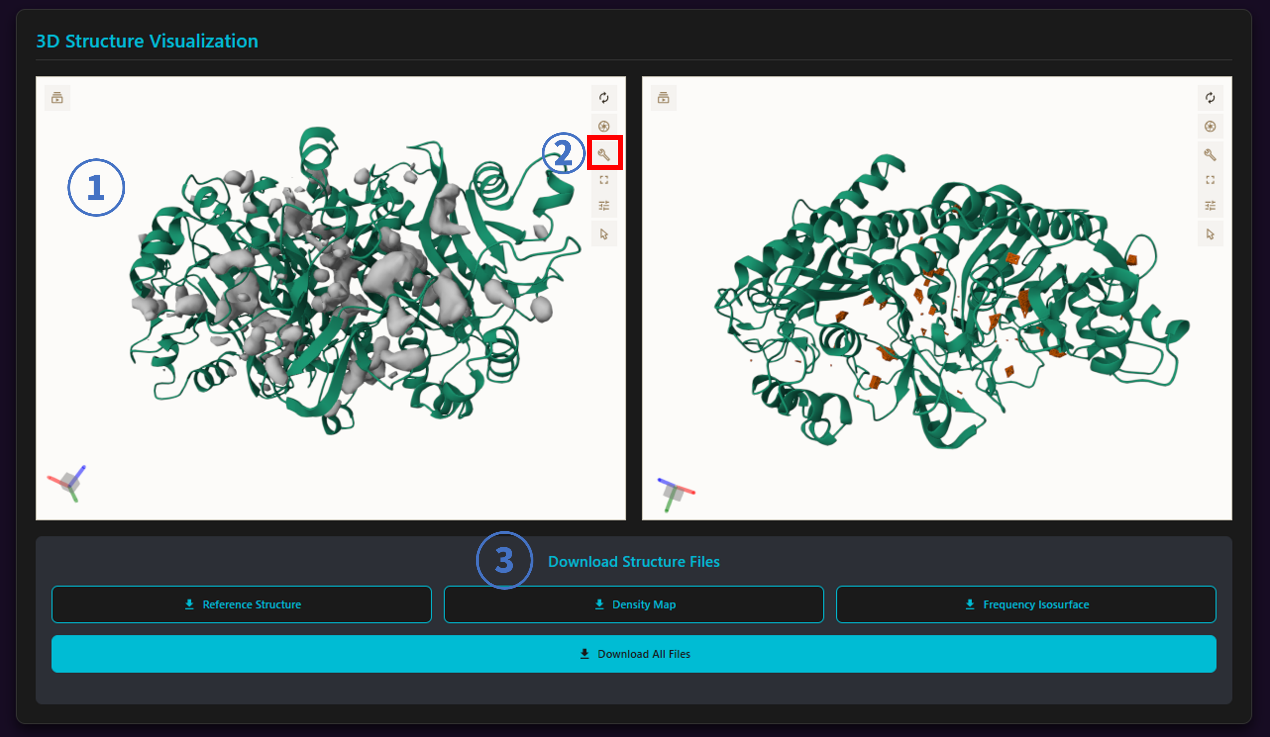
- Visualization Panel: 3D Structure of Molecular Dynamics pocket predicted by mdpocket model.
- Isovalue adjustment tool:
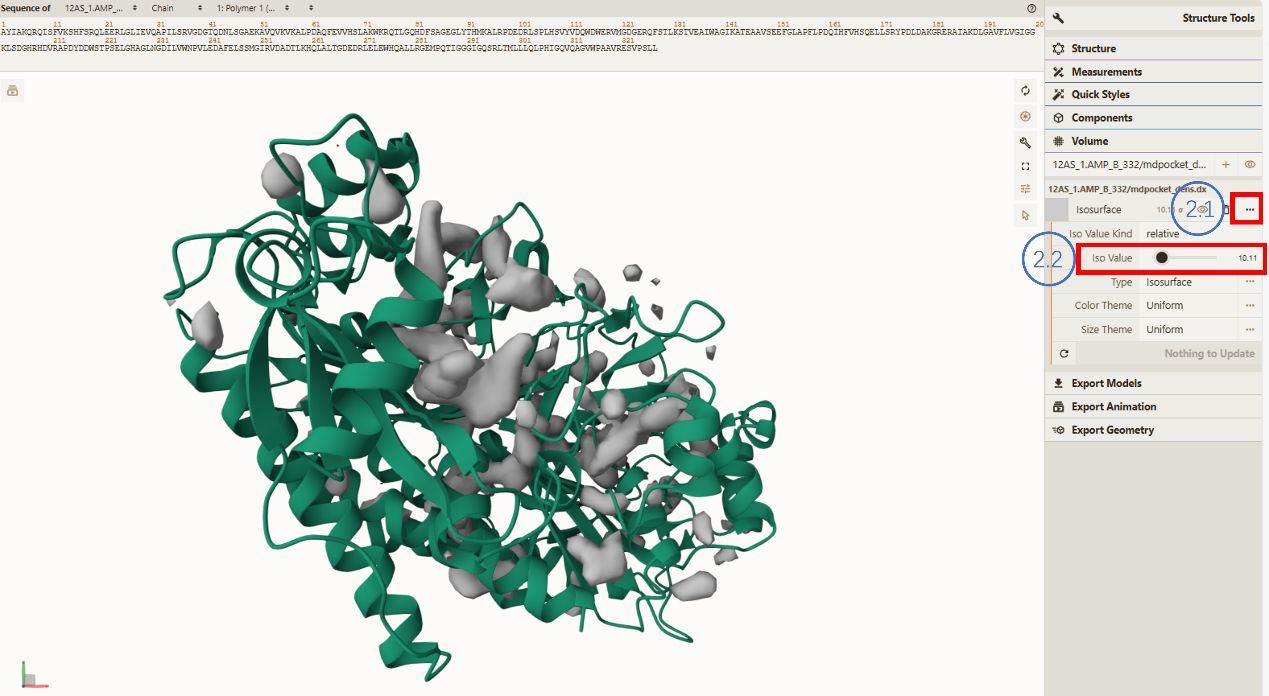
You can play with the Isovalue slider to get more or less conserved cavities during the MD trajectory. The unit of this isovalue can be expressed as number of Voronoi Vertices (alpha sphere centers) in a 8ų cube around each grid point per snapshot.
Download Structure Files
Our website offers three types of files for download:
- Reference.pdb: The centroid frame obtained through clustering analysis.
- Density Map (mdpocket_dens.dx): Output grid file containing frequency measures.
- Frequency Isosurface (mdpocket_freq_iso_0_5.pdb): Contains all grid points having 3 or more Voronoi Vertices.
3.2 Dynamics Data Analysis
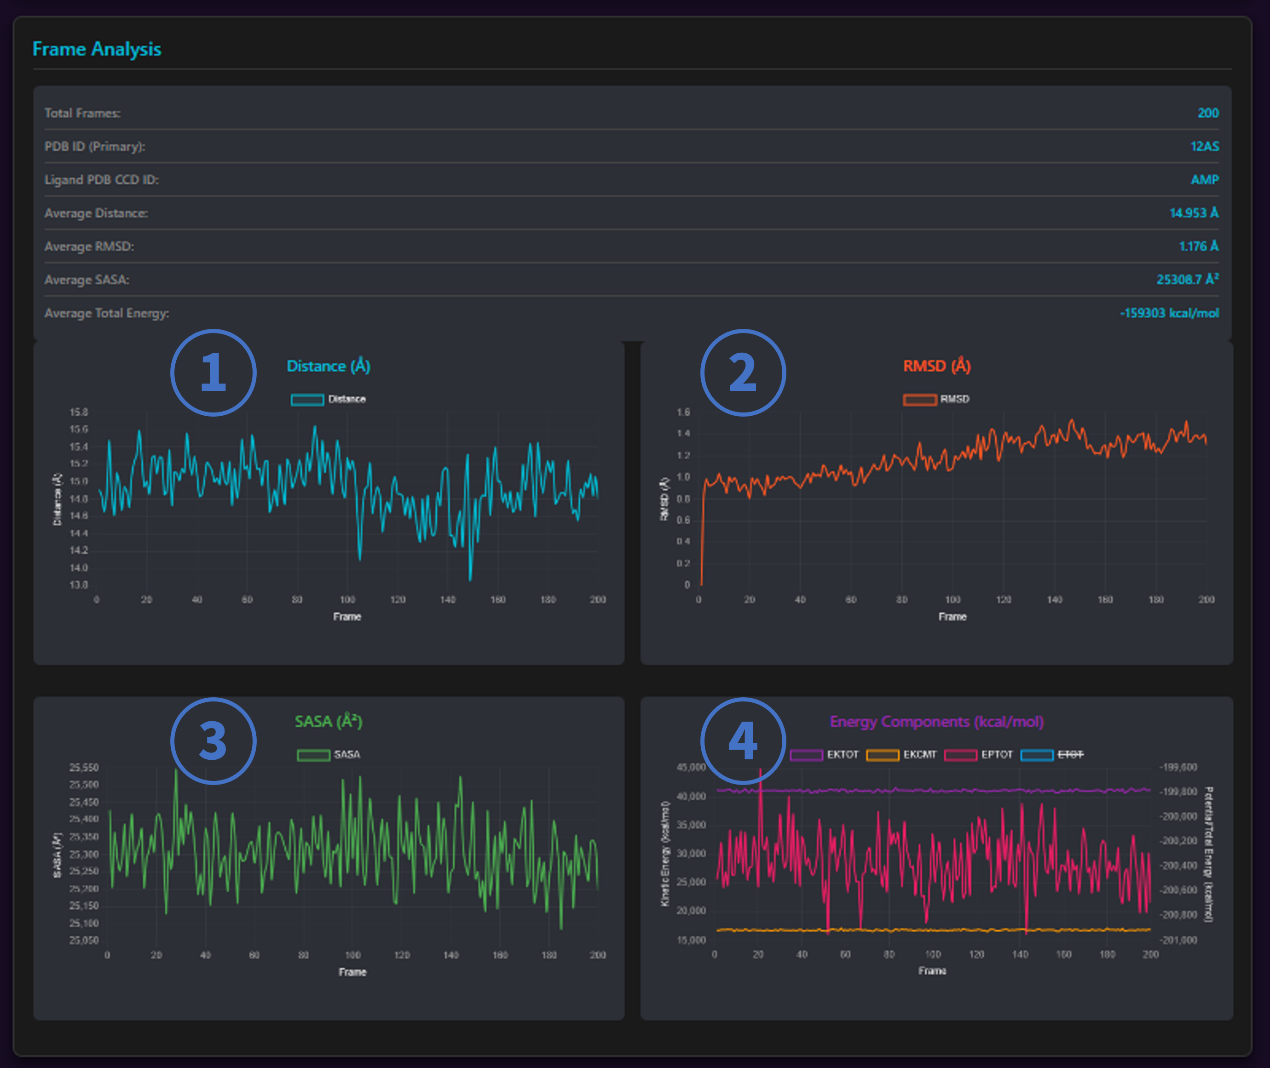
We provide four line charts to show the distance of ligand to proteins, rmsd, SASA, and energy fluctuations in MD.
- Distance: The average distance between ligand and protein.
- RMSD: Root Mean Square Deviation
- SASA: Solvent Accessible Surface Area
- Energy: ETOT (Total Energy), EKTOT (Total Kinetic Energy), EPTOT (Total Potential Energy), EKCMT (Kinetic Energy of Center of Mass Translation)
4. Protein-Ligand Interaction Page (Detail)
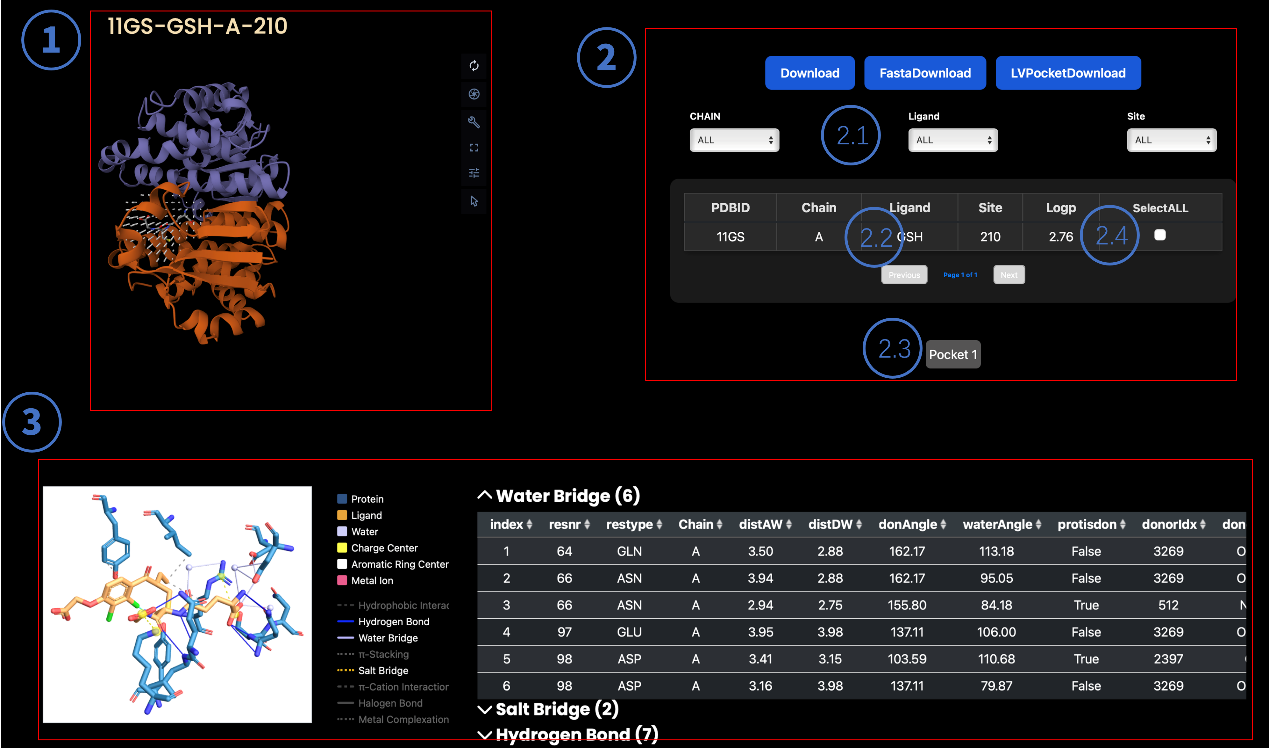
4.1 Visualization Panel
- 3D Structure: Interactive display of the protein-ligand complex.
- Controls:
- Rotate: Left-click and drag.
- Zoom: Mouse scroll wheel.
- Naming Convention: PDBID-Ligand-Chain-Pocketsite
4.2 Interaction Control Panel
Display Customization
- Binding Pocket Location (CHAIN)
- Ligand Conformation (Ligand)
- Interaction Sites (Site)
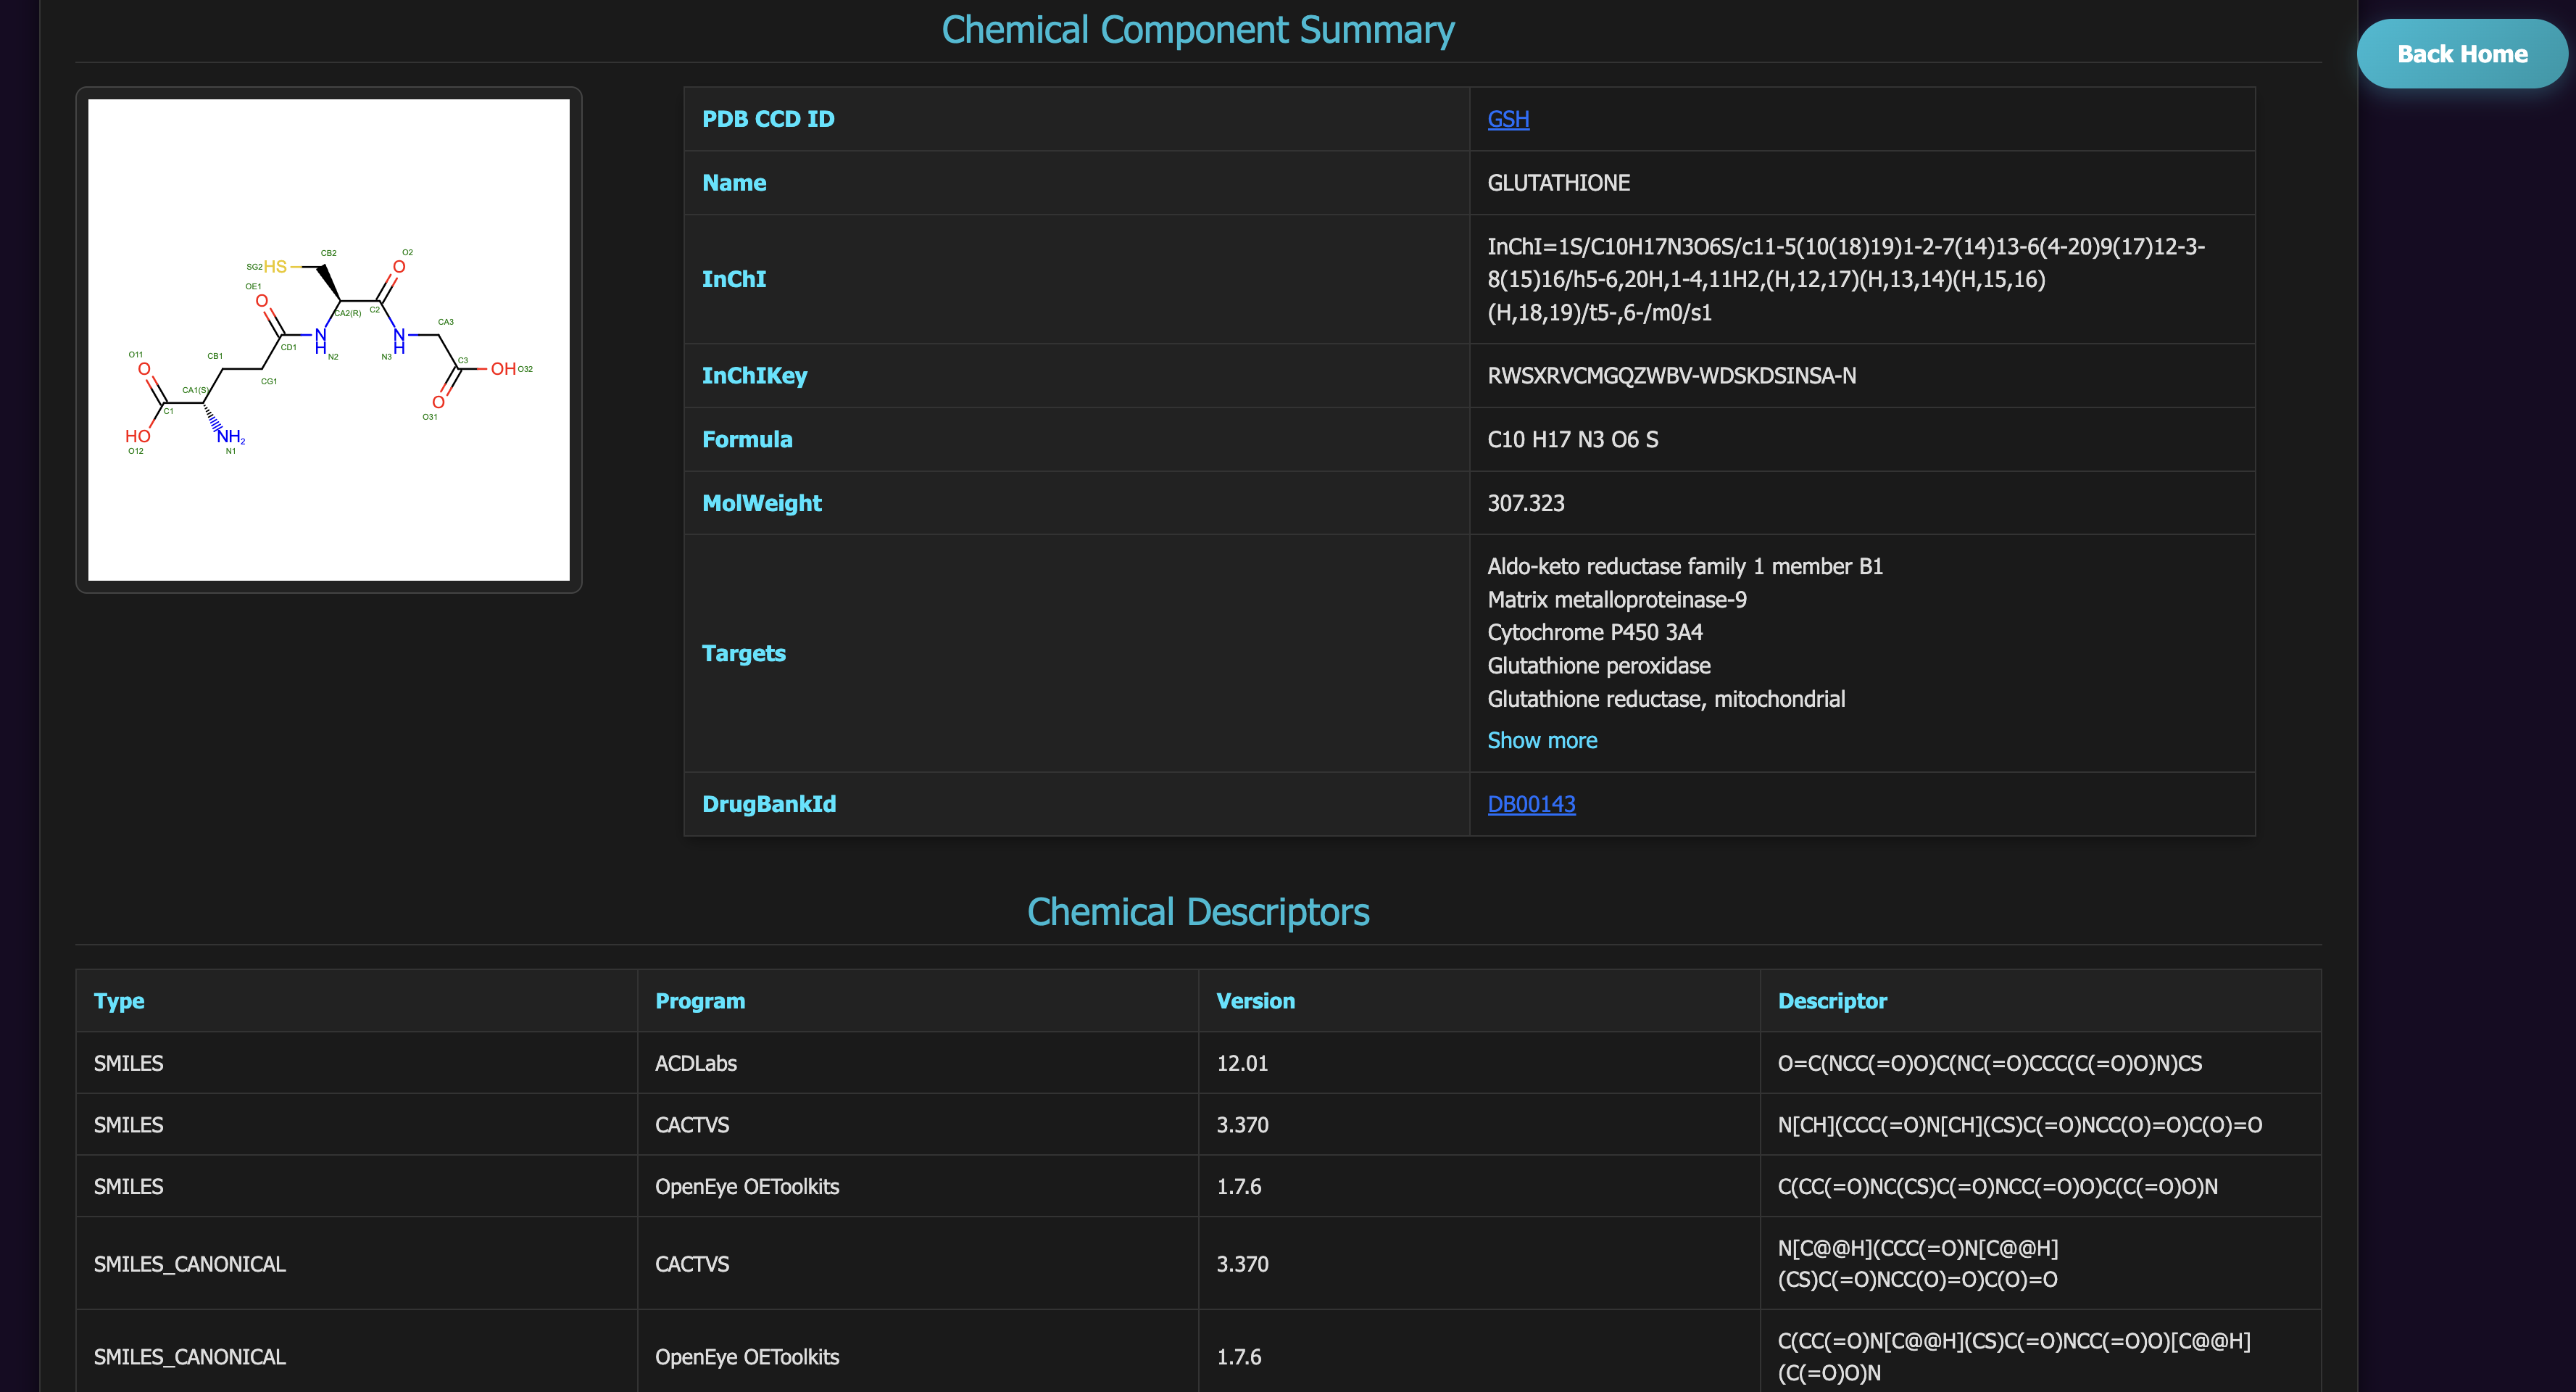
Ligand Details
Clicking Ligand displays its molecular properties.
Data Download
- LVPocketDownload: Download predicted pockets (if available).
- Download: Export selected protein/ligand/site combinations (PDB/mol2 formats).
4.3 Interaction Analysis
Quantitative characterization of non-covalent interactions (calculated via PLIP).
Take the water bridge, for example:

| Parameter | Description |
|---|---|
| pdbid | Unique identifier in the Protein Data Bank (PDB) |
| resnr | Residue Number |
| restype | Residue Type |
| reschain | Protein chain hosting the residue |
| resnrLig | Ligand residue number (positional identifier) |
| restypeLig | Ligand Residue Type |
| reschainLig | Ligand-Associated Chain. Chain where the ligand is bound |
| distAW | Atom-Water Distance. Spatial separation between a protein atom and bridging water |
| distDW | Donor-Water Distance. Length between hydrogen bond donor and water molecule |
| donAngle | Donor-Acceptor-Water Angle. Geometric angle reflecting hydrogen bond geometry |
| waterAngle | Water-Mediated Angle. Spatial orientation of water relative to interacting atoms |
| protisdon | Protein as Donor. Boolean flag indicating if the protein atom donates a hydrogen |
| donorIdx | Donor Atom Index |
| donortype | Donor Atom Type |
| acceptorIdx | Acceptor Atom Index |
| acceptortype | Acceptor Atom Type |
| waterIdx | Water Molecule Index |
| ligcoo | Ligand Atom Coordinates. 3D spatial position (X, Y, Z in Å) of the ligand atom |
| protoo | Protein Atom Coordinates. Spatial location of the interacting protein atom |
| watercoo | Water Coordinates. Position of the bridging water molecule |